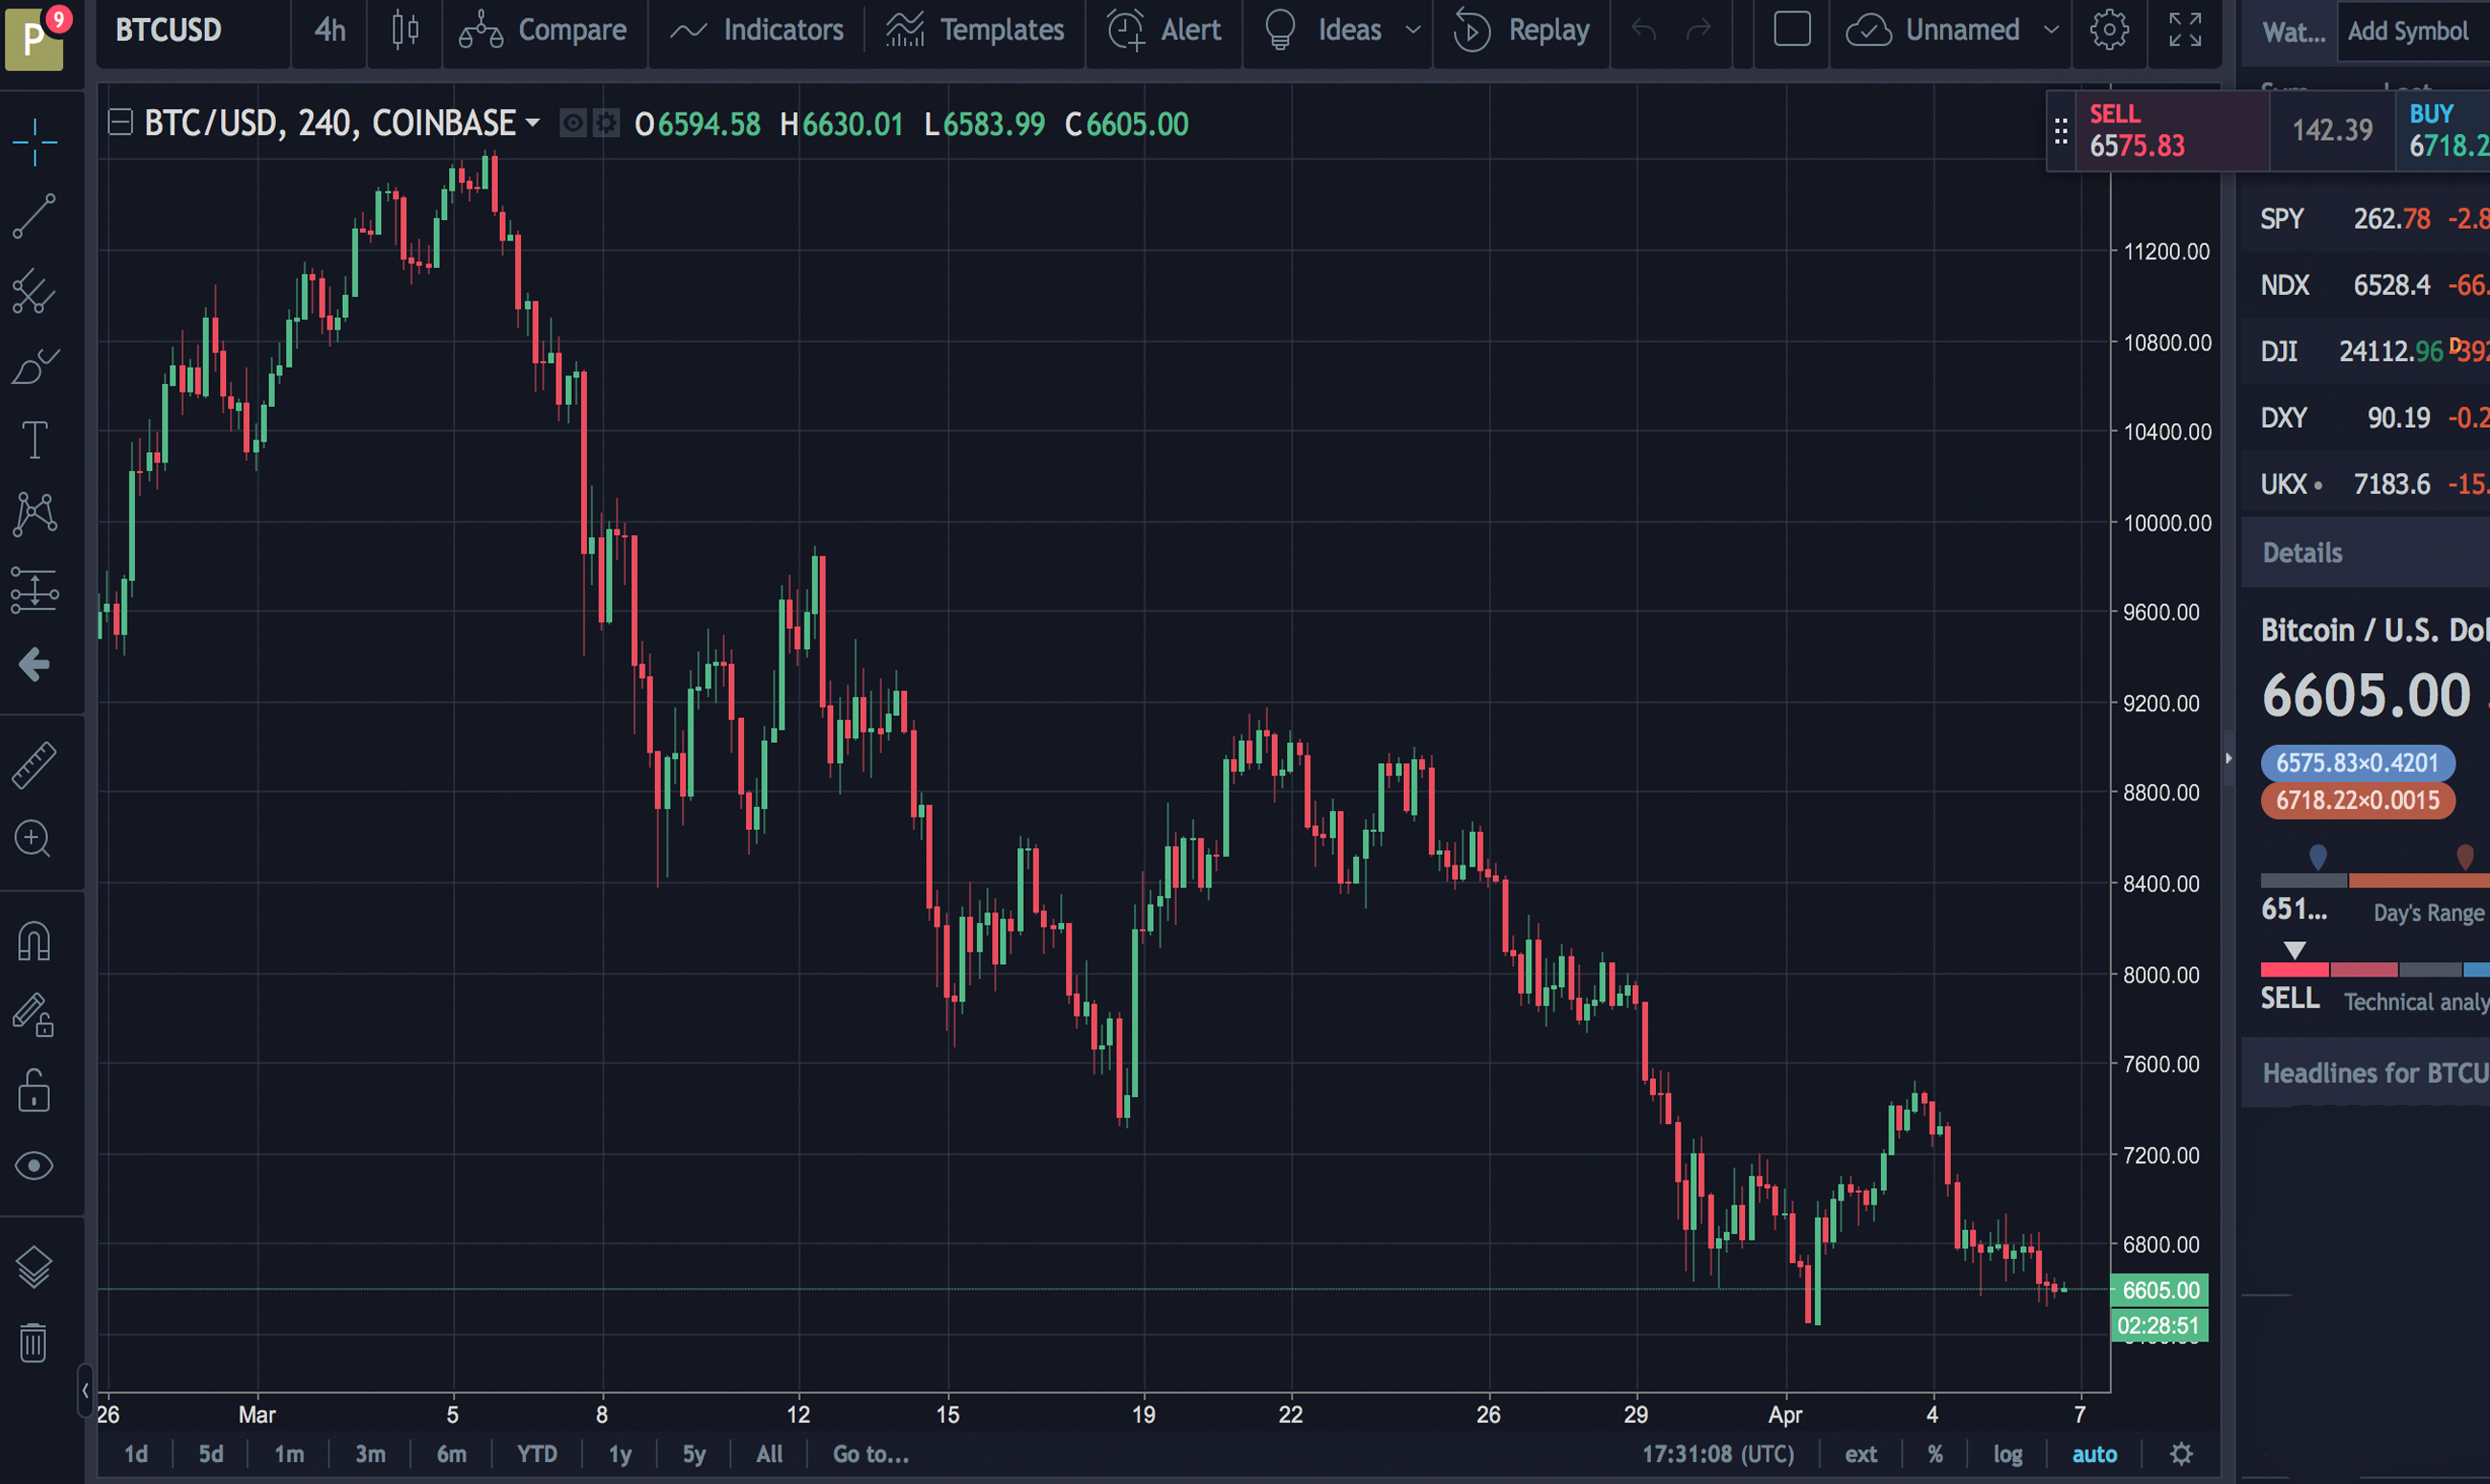
Cryptocurrency values are still slumping downwards as they have been for the past three consecutive months. Currently, the overall cryptocurrency market valuation of all 1,500+ digital assets is $248Bn after losing billions over the past few days. BTC/USD markets are below the $7K territory and recently touched a low of $6,510 per coin.
Also read: Huobi’s Sentiment Index Shows Cryptocurrency Investors Still Bullish
The Dumping Continues to Plague Cryptocurrency Markets
 The dumping continues to ensue as markets are still feeling the effects of a bearish phase the past few months. So far BTC/USD values have not yet double bottomed to the $5,900 low point but have been meandering awfully close to that price region. Today BTC volumes are weaker than usual as the past 24-hour trade volume has shaved a billion and rests at $4B right now. The top five exchanges swapping the most BTC includes Bitfinex, Okex, Binance, Bitflyer, and Huobi. All of the trading platforms are seeing much lighter trade volumes than our recently published Markets Update.
The Japanese Yen Comes Close to Capturing 60% of Global BTC Trades
One striking metric during today’s trading sessions is the amount of trade volume with BTC against the Japanese yen. The yen currently captures 57 percent of the global trade volume today with the USD falling behind (21%). Below the USD is tether (USDT 12.6%), the euro (3.1%), and the South Korean won (2.8%). BTC prices have a market cap dominance level of 45 percent out of the $248Bn and all 1500+ assets are swapping a measly $10.5 billion today.
BTC/USD Technical Indicators
Technical indicators show buyers are trying to breach past the $6,600 zone but have been unsuccessful so far. Most of yesterday’s trading sessions remained sideways at $6,800. Today there’s a touch of bullish action happening at the moment looking at the 4-hour BTC/USD chart but it’s not much. Both Simple Moving Averages (SMA) are again spread with the 100 SMA well below the long-term 200 SMA trendline. Both Macd and RSI Stochastic oscillators have been sliding southbound following the bearish divergence. Order books show that walls above the $7,600-8,200 zones are not too bad but bulls need to accumulate momentum to take the price to those levels. On the back side, BTC/USD order books show some really strong support around the $5,900 range once again. That specific foundational support flows all the way to the $5,400 range and traders can expect pit stops in those areas.

Bitcoin Cash Markets Nurse Deep Price Wounds and Flat Volumes
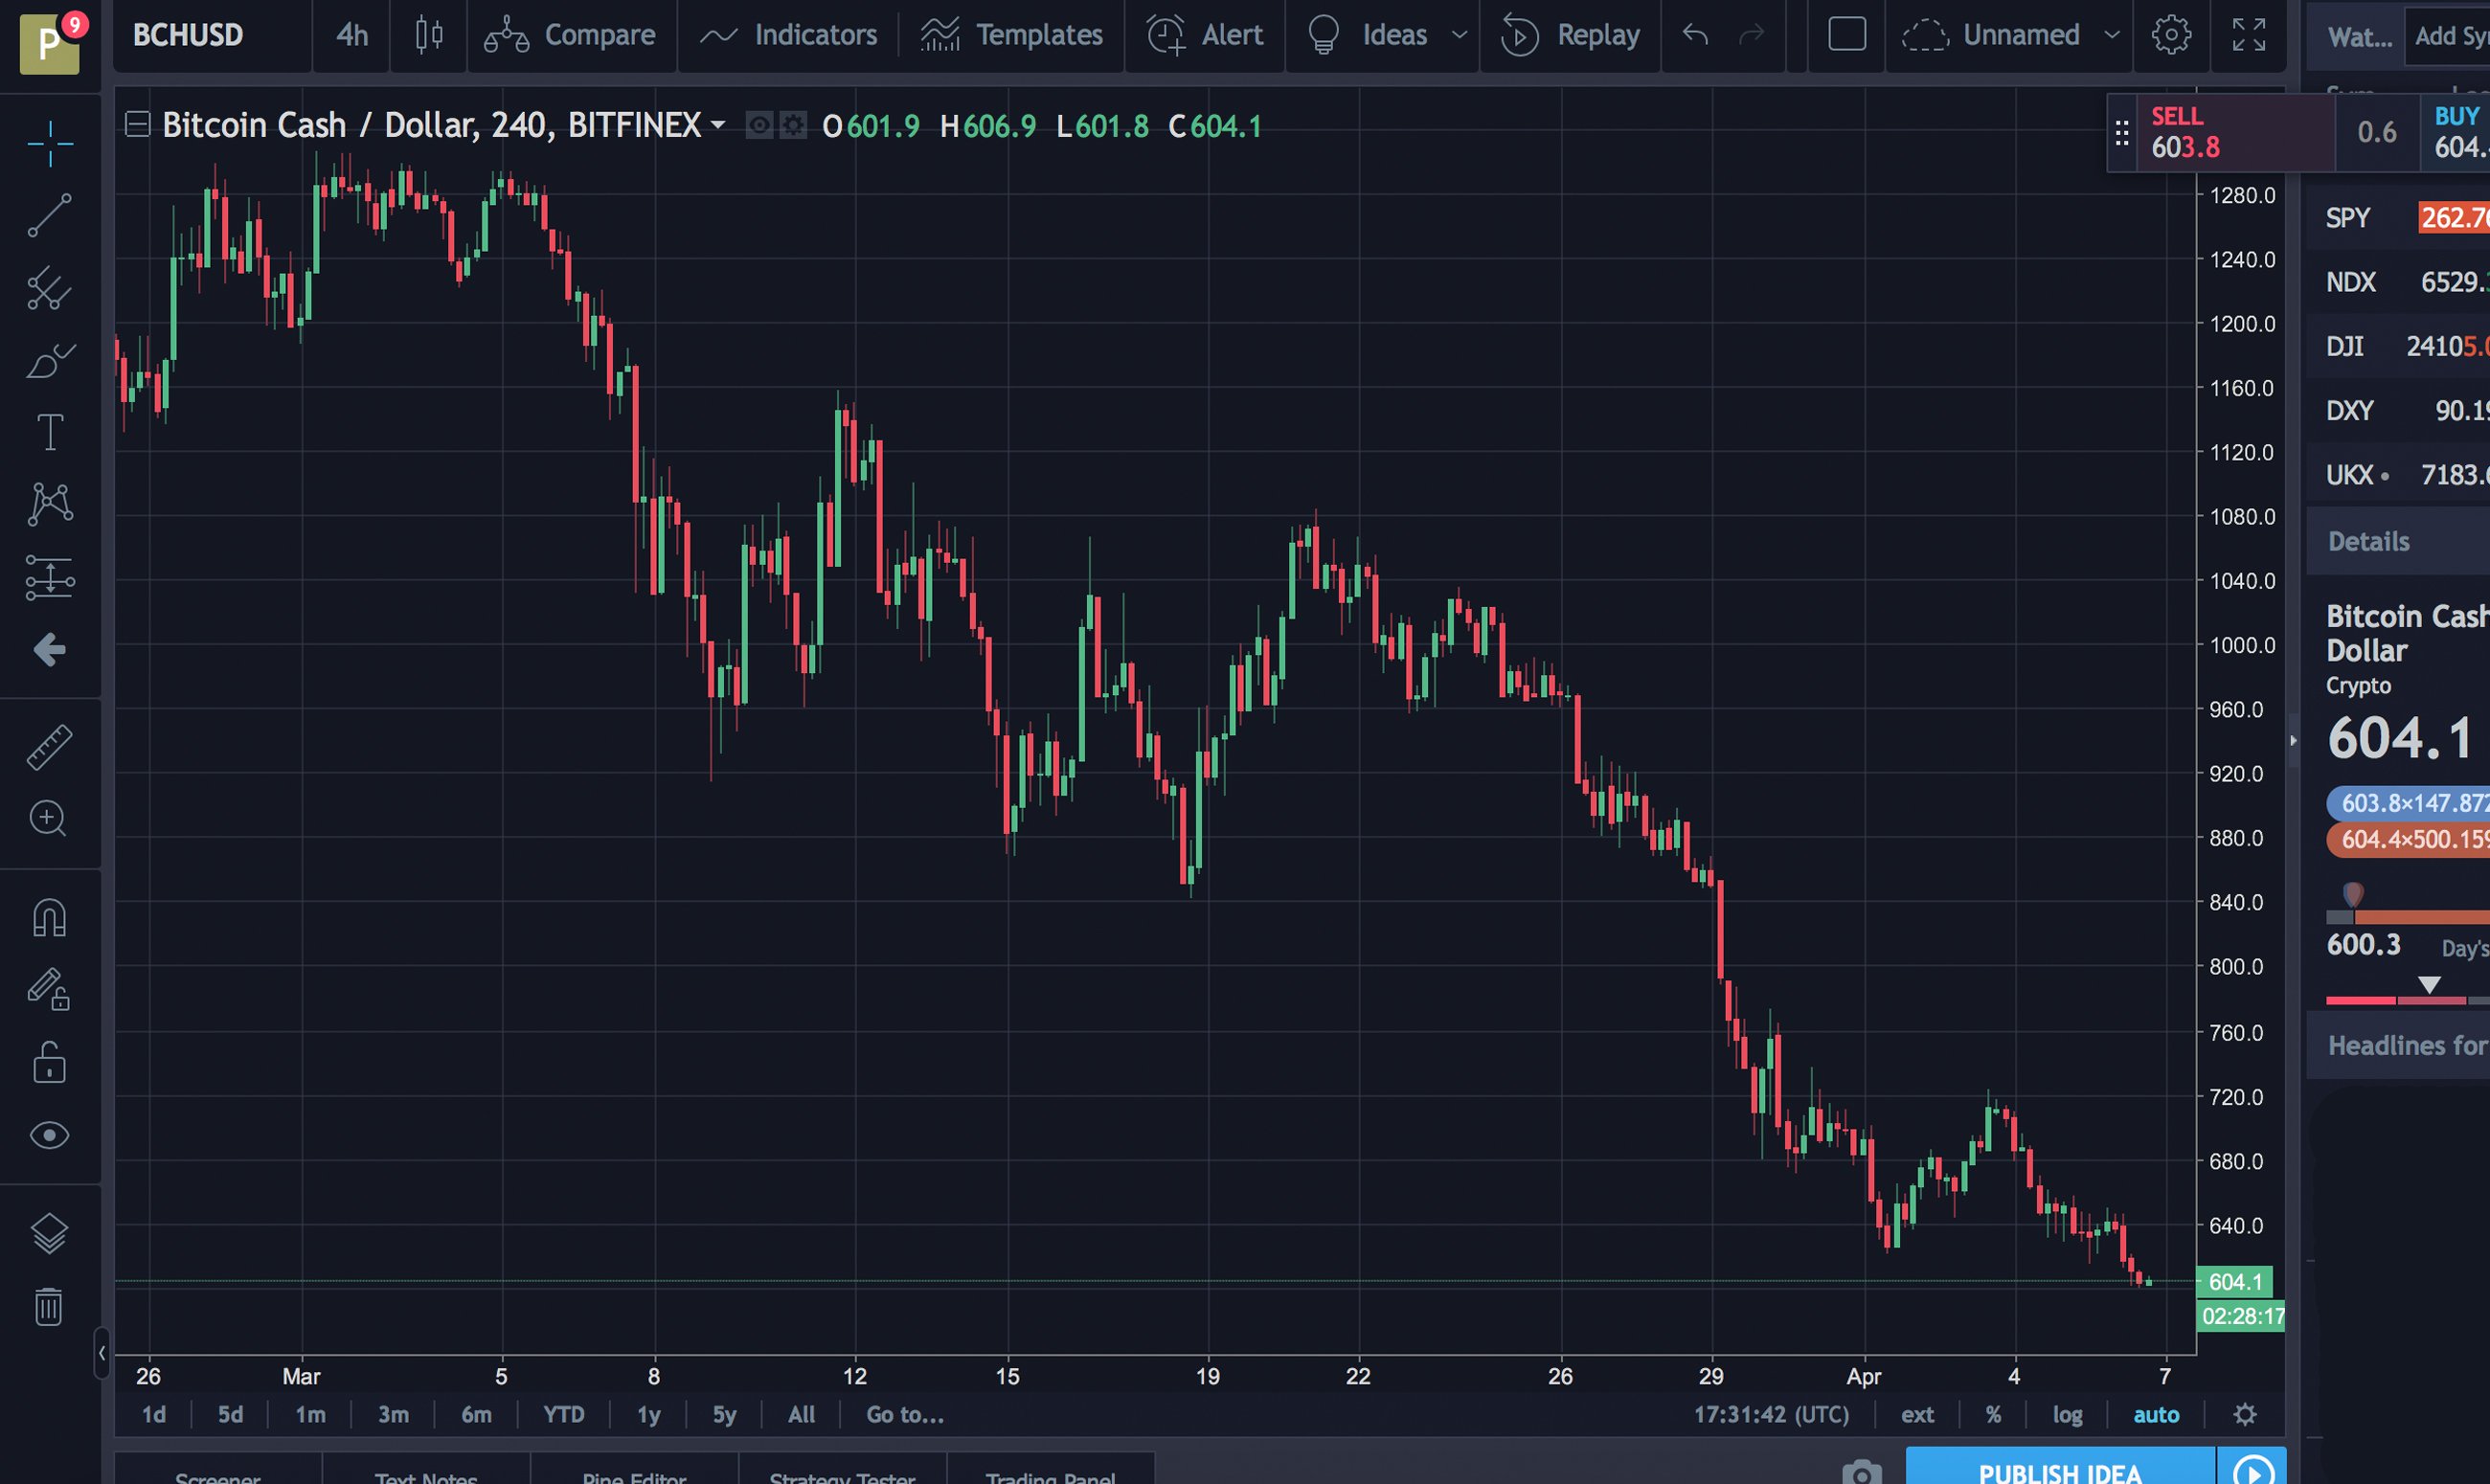
 Bitcoin cash (BCH/USD) markets are down 4 percent and the price is hovering just above the $600 territory at the time of publication. Volume is flat for global trade volumes as the BCH market has traded only $228Mn over the past 24-hours. The top five exchanges trading the most bitcoin cash during today’s trading sessions includes Hitbtc, Lbank, Okex, Huobi, and Bit-Z. Bitcoin core (BTC) trades against BCH is the most prominent currency pair today as the currency captures 54 percent of exchanges. This is followed by the USD (18%), tether (USDT 17.2%), the South Korean won (3.7) and Binance Coin (BNB 2.2%). Bitcoin cash is the eighth most traded cryptocurrency today by volume and the market holds a $10.3Bn market capitalization.
BCH/USD Technical Indicators
BCH/USD charts also show a significant bearish divergence as bitcoin cash has lost roughly $50 in USD value per coin since yesterday. Just like BTC, the SMA trendlines for BCH/USD markets are very similar as there’s a gap in between the 100 SMA and 200 SMA. The 100 SMA is well below the 200 SMA which indicates the path to resistance will be on the downside. Looking at the 4-hour window shows RSI Stochastic oscillators also indicate some bearish short-term sentiment. BCH/USD order books show much tougher buy and sell walls. There’s some solid resistance from the current vantage point of $650-675. On the backside, there are strong foundations between the $575 and $540 territories.

The Verdict: In the Real World Spring is Approaching but the Dreaded ‘Crypto Winter’ is Still Scaring Traders
Nearly every single cryptocurrency market besides tether USDT is down in value and some digital assets are struggling to recover. One notable altcoin market the past couple days is EOS/USD which actually has seen some gains. The cryptocurrency EOS has silently captured the number six position on Coinmarketcap just behind litecoin (LTC). The bearish markets have set a thick layer of uncertainty and skepticism towards crypto markets lately. Many traders are hoping for a reversal but there haven’t been any good signals indicating a frothy comeback is in the cards. For now, most traders are either weathering the storm by ‘hodling’ or riding the waves by shorting bitcoin all the way down on exchanges like Kraken and Bitmex.
Where do you see the price of BTC and BCH heading from here? Do you think cryptocurrencies will see more gains? Let us know in the comments below.
Disclaimer: Price articles and markets updates are intended for informational purposes only and should not to be considered as trading advice. Neither Bitcoin.com nor the author is responsible for any losses or gains, as the ultimate decision to conduct a trade is made by the reader. Always remember that only those in possession of the private keys are in control of the “money.”
Images via Shutterstock, Bitstamp, Trading View, and Coinmarketcap.
Want to create your own secure cold storage paper wallet? Check our tools section.
The post Markets Update: BTC and BCH Prices Continue to Slide appeared first on Bitcoin News.
Powered by WPeMatico

